The Pareto diagrams are widely known to be used as tools to improve operations and management, but its use is not limited to these areas: it’s a tool of general purpose.
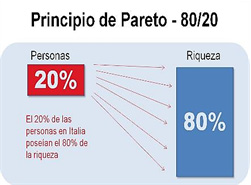
In a historical context, the Pareto Principle, which generates the respective diagrams, is based on the phenomenon observed by the Italian economist Vilfredo Federico Damaso Pareto who, in 1906 made the famous observation that 20% of the population possessed 80% of all properties in Italy. If Pareto had lived in our present time, his observation would have probably led him to establish a different proportion to this percentage. (According to the 2015 OXFAM report, 1% of the world’s population holds 50% of the wealth and the other 50% is distributed among the other 99%, but that is another topic).
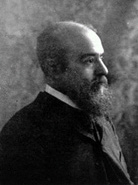
(1848 – 1923)
It is interesting to mention that by the year 2003 there was an intention to rename this principle as the “Juran Principle”, initiative that came from the American Society for Quality (ASQ), since it was in 1937 that Joseph Juran revealed this principle, as mentioned by Luis Felipe Sexto in his article “¿Fin del Principio de Pareto?” (End of the Pareto Principle?). This initative was obviously left in oblivion.
The Pareto Principle states that there are several contributors responsible for the highest deal of problems being under research. The other contributors are typically responsible for a relatively small portion of the problems.
This is frequently stated by the 80/20 rule, which says that 80% of the problems under research are caused by only 20% of the contributors.
The usual process to build a diagram of Pareto includes four steps:
- Determining the contributors of the problem under research.
- Determining the level of contribution from every person involved.
- Drawing a bar diagram from these results.
- Adding a line that shows the cummulative percentage achieved by the sum of each additional contributor.
The main contributors are referred to as “few vital” and the minor contributors as “several trivial”.
It is also frequent to denominate the “few vital” as the “top ten” or “bad actors”. This term doesn’t refer to actors from series B movies, those who will never be nominated and thus will never win an Academy Award, or those nominated for the “Razzi” Awards for their lousy acting.
One of the reasons to write this article was the occurrence of three recent events, in which the “bad actors” topic was mentioned. The first one was in a meeting with operations, maintenance personnel and maintenance contractors. A list of bad actors was suggested without a defined criteria and based on personal considerations by some of the attendees.
One of the confusions I could detect was mixing critical equipment with bad actors. For some of the attendees, a high criticality equipment was a “bad actor” per se; others referred to the way this equipment affected the operational capacity of the section at the plant they were in charge. The frequency of failure of an equipment was also mentioned.
The second occasion was in another meeting where they told us that the client of a maintenance service requested the report of “bad actors” from the contractor. Which was the criteria? In a very ethereal way, a low MTBF was reported as the criteria to classify a “bad actor”.
Finally, the third event occurred when the reliability area of a plant presented its list of “bad actors” based on the maintenance cost, which would sound quite adequate. But this included the preventive and corrective maintenance costs of equipment, thus showing an incorrect image of the “bad actors”, because the expenses from the main “bad actor” consisted on 90% of preventive maintenance cost. If only corrective maintenance were considered, the ranking drifted remarkably. This brought attention to “bad actors” that were not really so.
Which should be the criteria to choose the “bad actors”? Anthony Smith in his book “RCM – Gateway to World Class Maintenance” specifies three criteria:
1. Cost of corrective maintenance accumulated by the equipment within a recent period of two years.
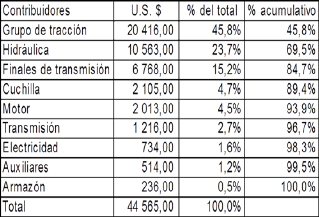
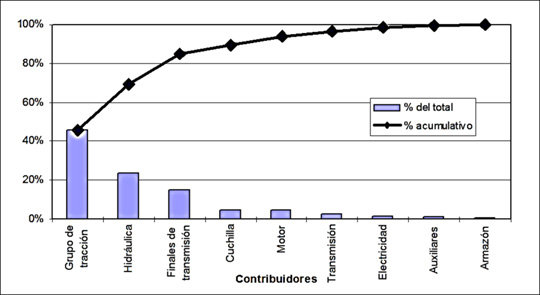
The following is an example of a diagram of Pareto built on the corrective maintenance cost of components from a fleet of tractors (See Figure 1 and 2).
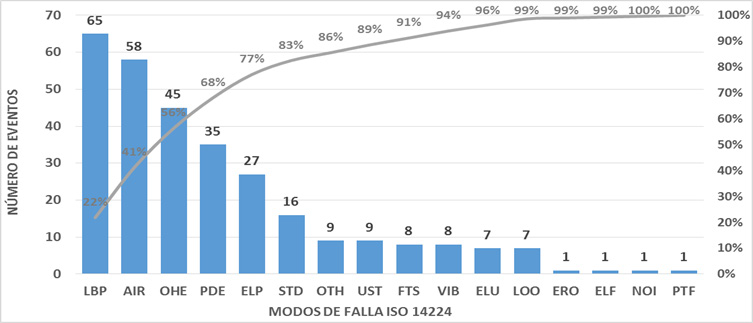
2. The number of corrective maintenance events executed on the asset within a recent period of two years.
The following figure shows a Pareto diagram by number of events for a for a set of reciprocant gas compressors where failures have grouped by failure mode following ISO 14224:2006 for a period of 12 months (See Figure 3).
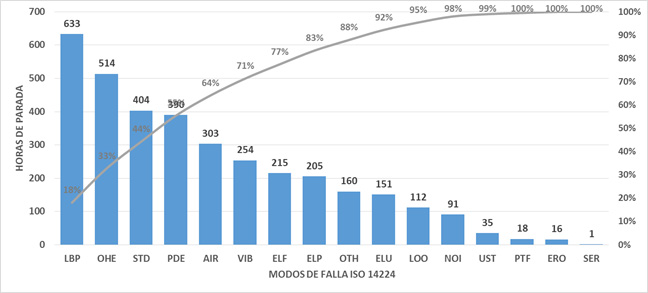
3. Number of events attributed to plant shutdowns during a recent period of two years.
The following figure shows a Pareto diagram by plant shutdown hours for a set of gas reciprocant compressors, where failures have grouped by failure mode following ISO 14224:2006 for a period of 12 months (See Figure 4).
With the current capacities for information processing, we shouldn’t have problems to handle the three calculations.
Using only the corrective maintenance cost leaves aside the impact of the equipment failure in production. In my personal experience, I have found cases in which the cost of corrective maintenance jobs is much lower than the costs generated from plant shutdowns. In one of them, the cost of corrective maintenance was around US$ 25,000 but the cost of unfinished production was US$ 1, 200, 000, that is, 48 times the cost of the corrective cost. This could be detected using a Pareto for hours of shutdown caused by the assets.
Finally, a Pareto with bad actors by number of events can help us identify recurrent jobs that could not necessarily mean a bad actor, but the accumulation of similar events and the resources that should be taken from other areas could become significant for the distribution of resources to personnel, considering the time of the task itself a well as the administrative time for obtaining work permits and other job safety matters.
The advisable thing to do is the development of a document by our organization which establishes the criteria to define the bad actors from our Paretos, whose elimination will contribute to the achievement of the organizational goals.
Finally, I wish to leave you an idea for discussion. After Reading the book by Daniel Denett, “Intuition Pumps And Other Tools for Thinking” , I found the “Sturgeon Law” expressed as “ninety percent of everything is crap”, meaning that 90% of the literary production on science fiction is of very low quality. Many propose to extend this law to other fields of human activity.
References
- Wealth: Having it all and wanting more, Oxfam International, Oxfam GB, 2015
- RCM–Gateway to World Class Maintenance by Anthony M. Smith and Glenn R. Hinchcli e, Butterworth-Heinemann; 2003
- RCM–Gateway to World Class Maintenance by Anthony M. Smith and Glenn R. Hinchcli e, Butterworth-Heinemann; 2003
Autor: Víctor D. Manríquez
CMRP Ingeniero Mecánico.
Mag. Energías Renovables
Líder de Confiabilidad
CBI Peruana SAC
Docente IPEMAN
Perú
Correo: vmanriquez62@yahoo.es


0 comentarios